This project was completed in 2020, during my first year of engineering. Creating this program taught me a lot about data visualization
and data iteration in Python. This program allows users to access specific data about a country of their choice and graphs the data neatly for visual analysis.
The program imports three .csv files, which contain data about geographical, population, and species data.
Specs
Software: Python
Dependencies: numpy, matplotlib, pandas
Code Repository:
Project Details
This project was completed as an assignment for ENDG 233, a first year engineering course at the University of Calgary with focus on programming with data.
The program reads data from three .csv files. One file contains geographical data from countries around the world, another contains country population data, and
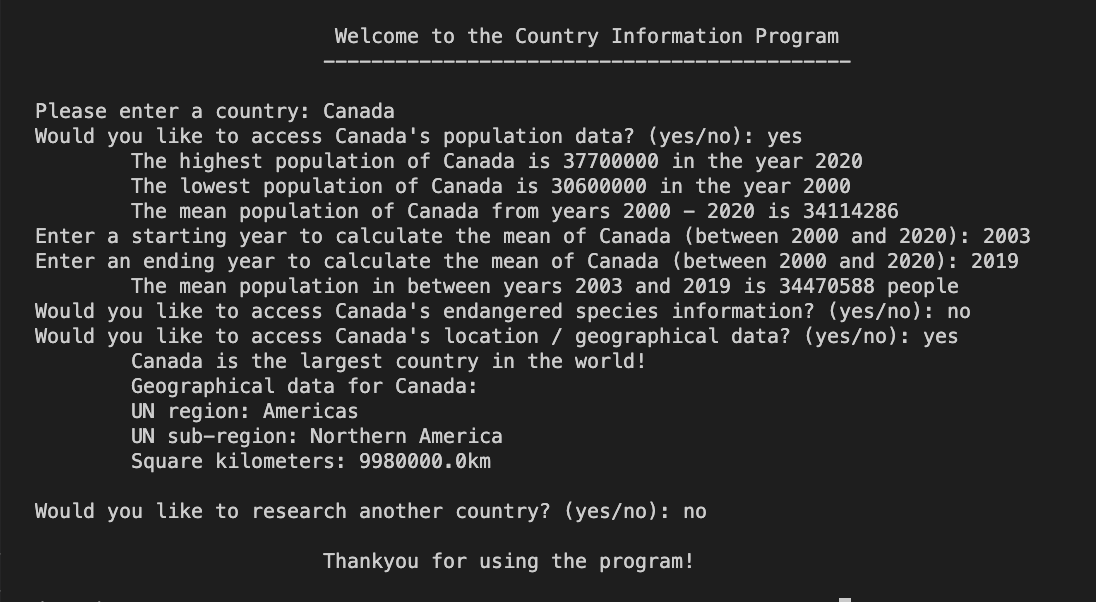
the last file contains threatened species data. Throughout the program, users are prompted to input different statistics they would like to access. These user inputs
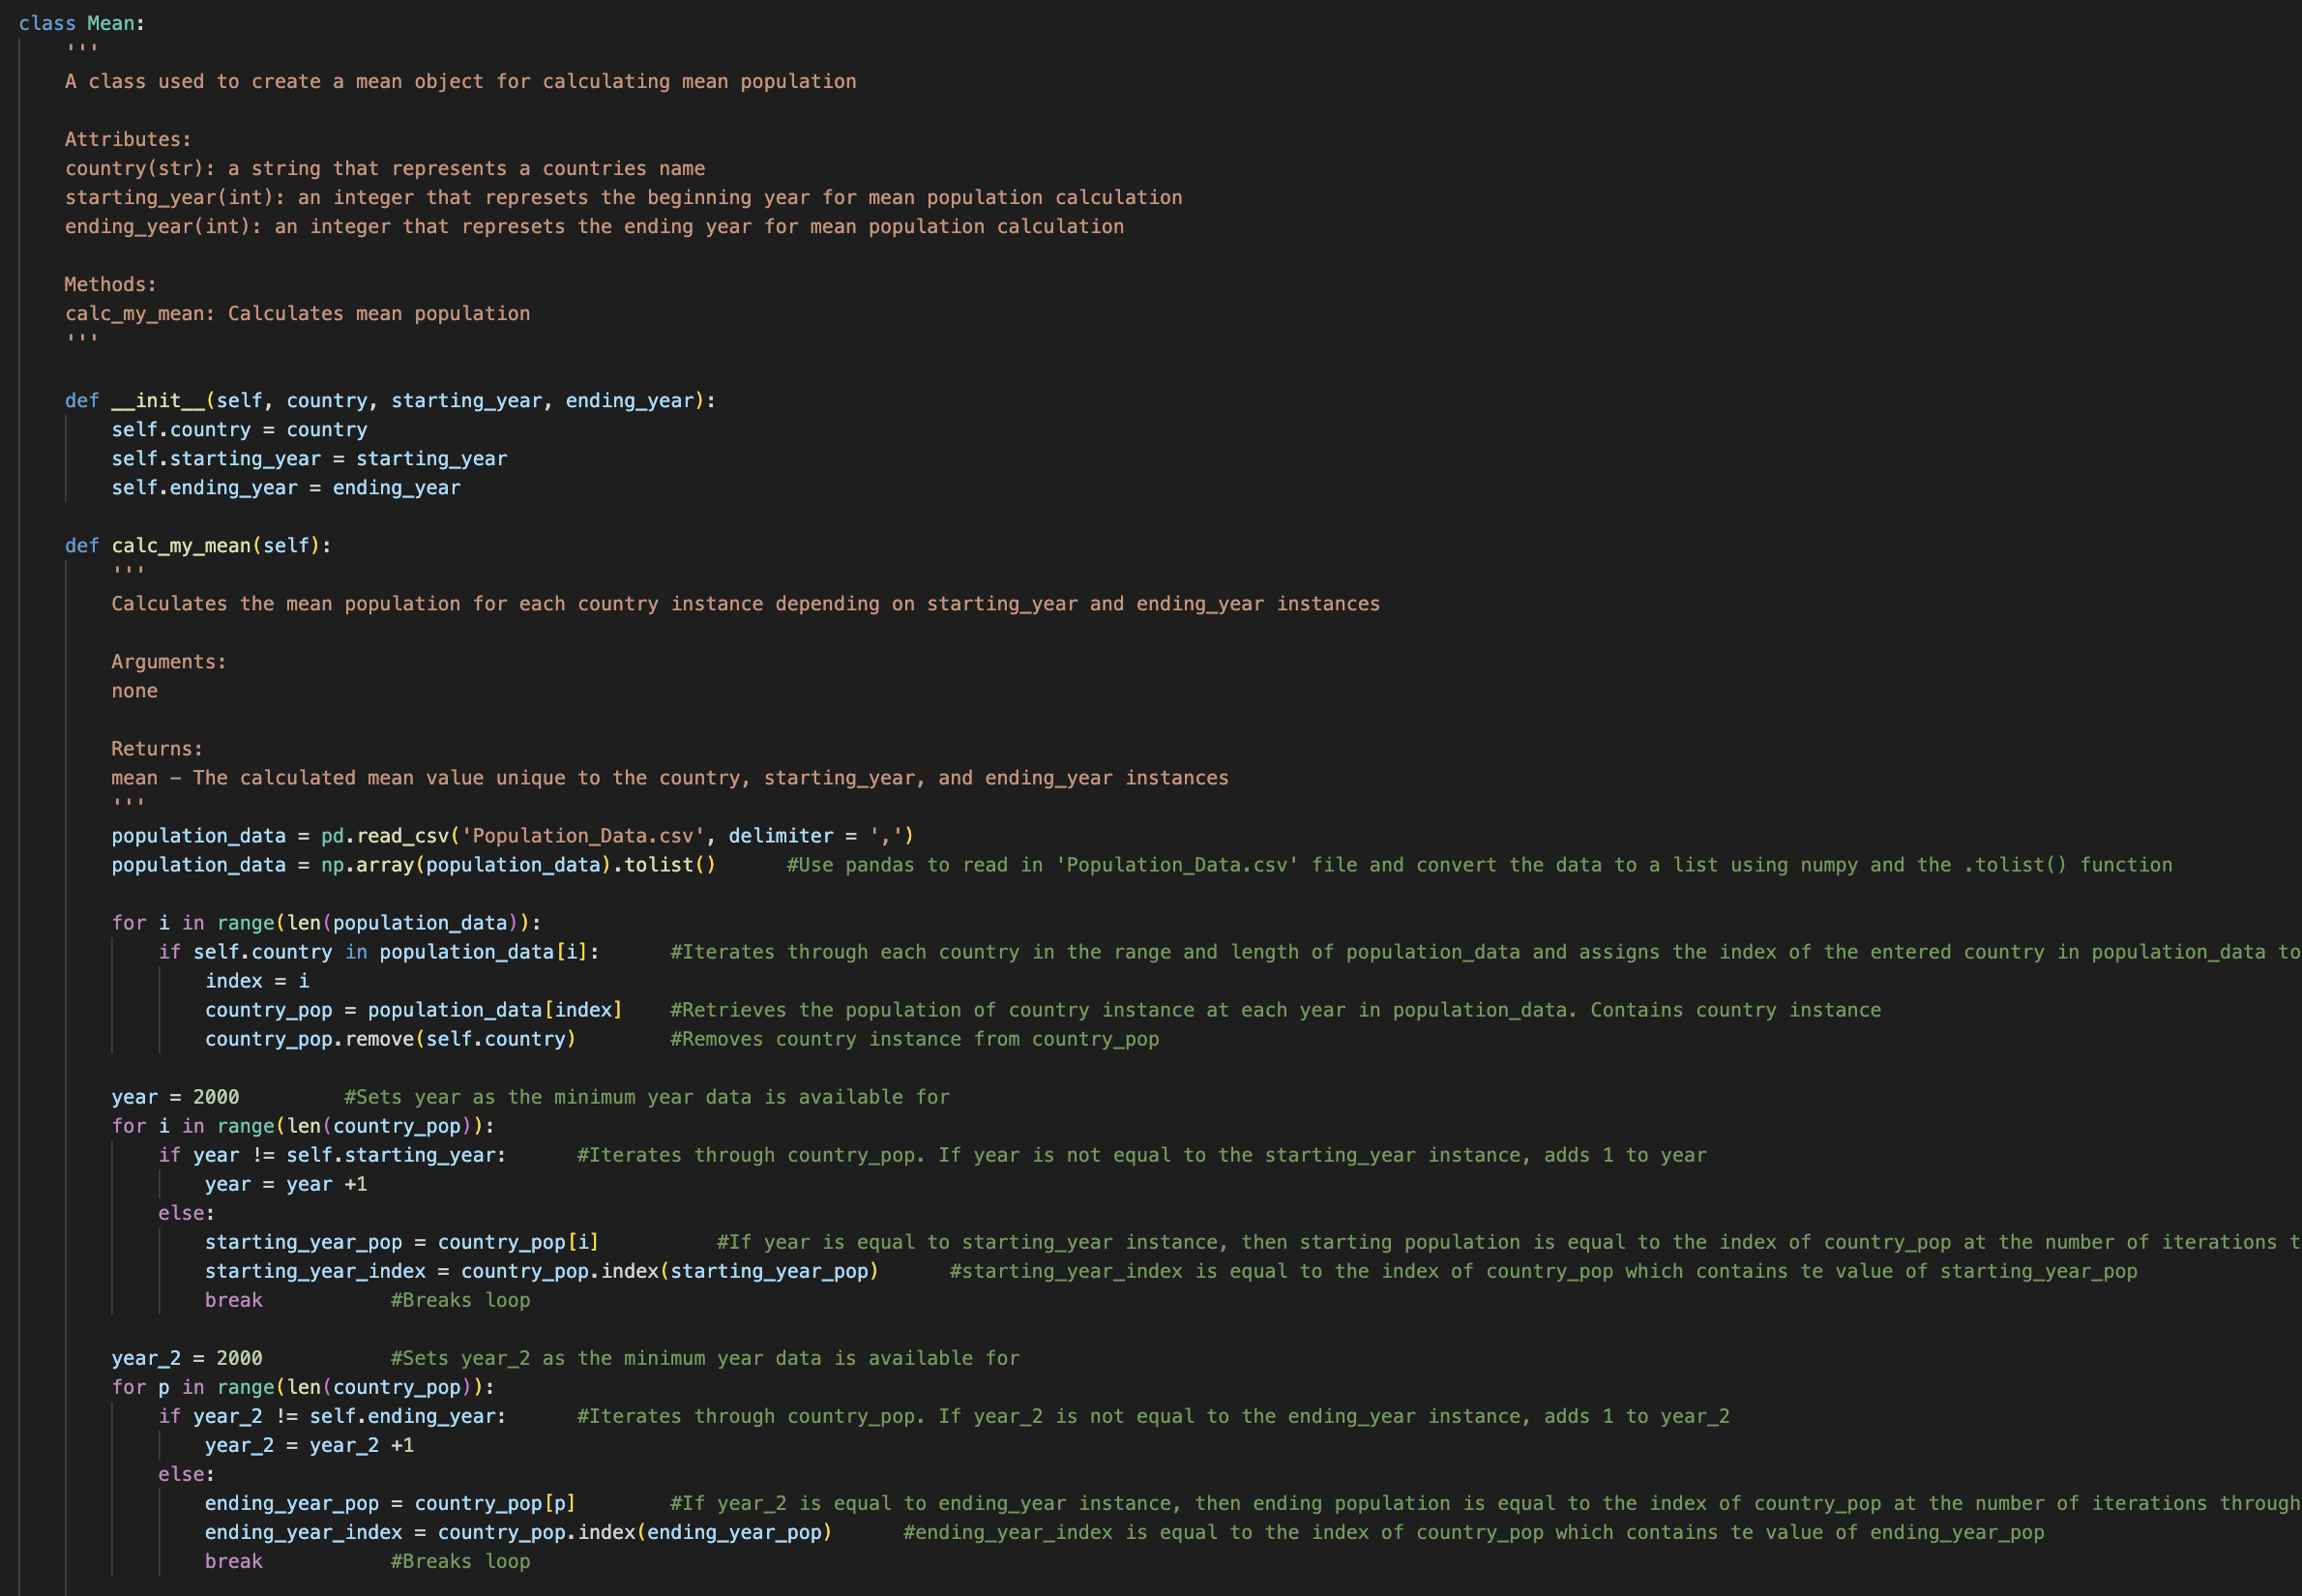
are used to itterate through the data in the csv files and return the desired data and statistics. The output statistics of the program are very customizable and unique
for every runthrough. Basic arithmetic is performed on certain statisics, such as calculating mean, average, total, max, min, etc.
Exception handling is implemented to ensure invalid inputs do not result in a crashed program. Rather, the user is repeatedly prompted to enter valid input.
After the program has recieved all the input required to generate the custom statistics on the country of the users choosing, the data is graphed neatly for visual analysis using matplotlib.
The number if graphs and statistics outputted is a direct result of the users input to the prompt questions asked throughout the program.
Demonstration
Contact Me
Reach Out
Feel free to contact me at any time. I welcome all feedback and suggestions for this site or any of the projects here.